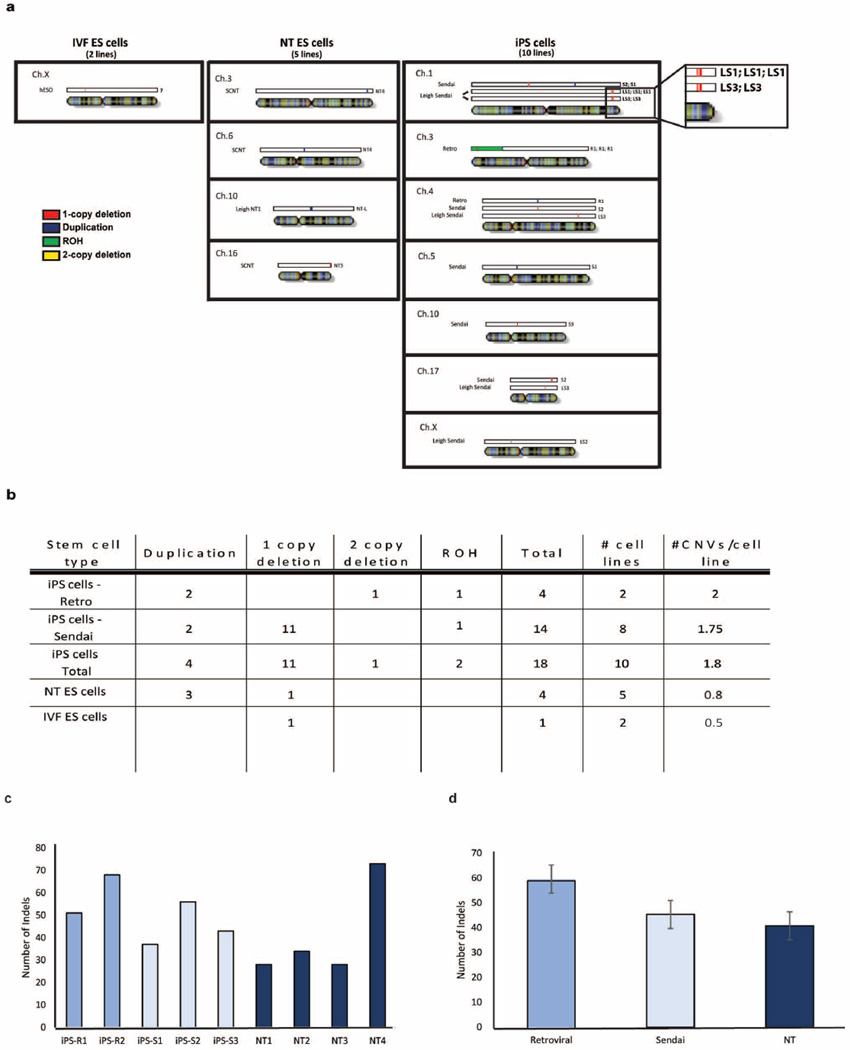
Extended Data Figure 2. Subchromosomal genomic aberrations in IVF ES cells, NT ES cells and iPS cells.
a, The location and type of CNVs for all mapped samples. One-copy deletion regions are shown in red, two-copy deletions are in yellow, duplicated regions (three copies) are in dark blue, and runs of homozygosity (ROHs) are in green. b, The average number of CNVs per stem cell type for IVF ES cells, NT ES cells and iPS cells. Owing to the small sample sizes, no statistically significant differences were found between sample groups. c, Bar graphs displaying the number of InDels by sample. d, Bar graphs showing the average number of InDels found in the iPS cell lines and NT ES cell lines. No statistically significant differences were found between sample groups. Error bars, s.e.m.

