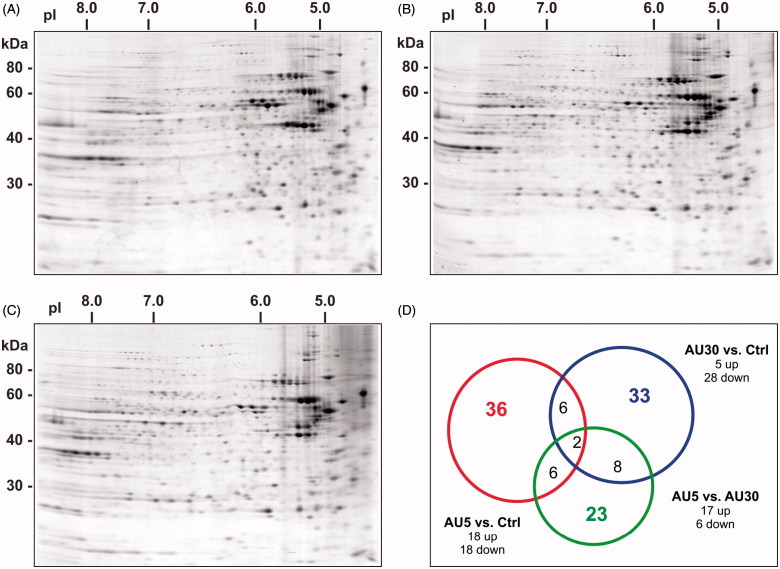
Figure 2.
Proteomic analysis of the cytoplasmic extract of Caco-2 cells exposed to AuNPs. Representative two-dimensional gel protein maps of cytoplasmic fractions of (A) untreated (Ctrl), (B) treated with 5 nm AuNPs, and (C) treated with 30 nm AuNPs cells for 72 h. (D) The Venn diagram is showing the distribution of differentially expressed proteins: 5 nm AuNPs versus Ctrl (red circle, 36 proteins), 30 nm AuNPs versus (blue circle, 33 proteins) or 5 versus 30 nm AuNPs (green circle, 23 proteins). Number inside overlapping region of two circles refers to the spots common to different groups (For color figure refer to the online version.)

