
Figure 2.
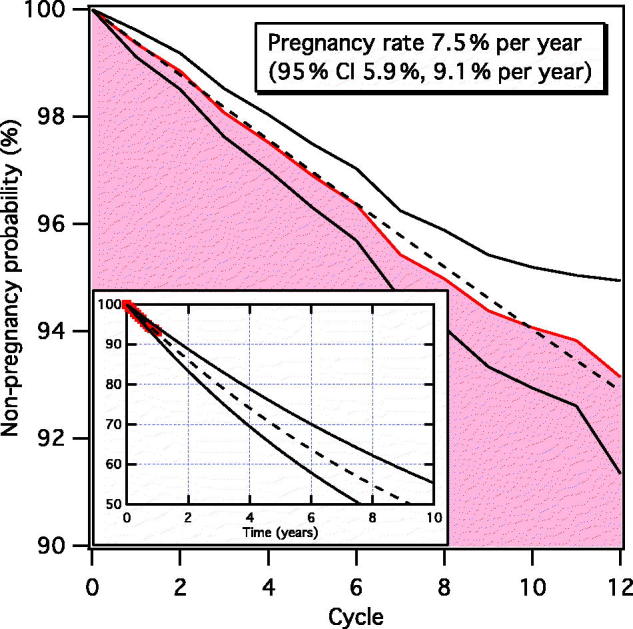
The probability of not becoming pregnant over time, measured in ordinal cycle number. The filled red area is based on experimental data from Table 5 and black solid lines are the corresponding 95% CIs. The black dashed line is the fitted probability of not becoming pregnant, from which the pregnancy rate is calculated. The inset shows the evolution of the non-pregnancy probability over several years predicted by the fitted pregnancy rate (black dashed line). Experimental data are here shown as a red line, whereas black solid lines correspond to the fitted pregnancy rates of the 95% CI.