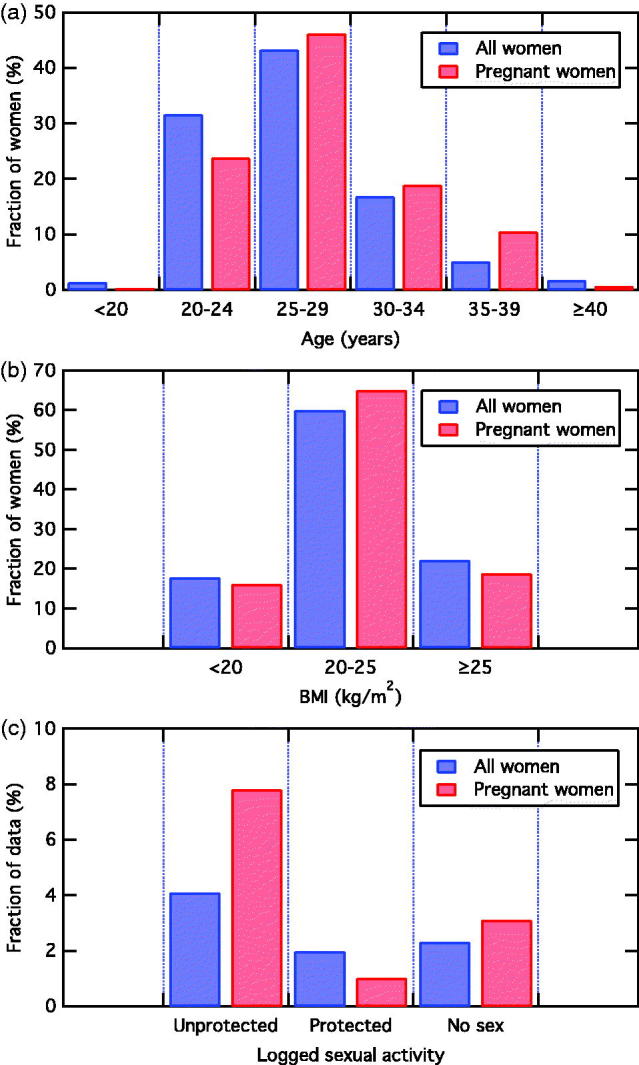
Figure 3.

Comparison of age (a) and BMI (b) distribution of all participants (blue) listed in Table 2 with that of only pregnant women (red). Both distributions are normalised to the total number of women who make up each distribution (3993 women and 143 pregnant women, respectively). (c) Comparison of logged sexual activity for all women (blue) and pregnant women (red), in terms of unprotected intercourse, protected intercourse and no intercourse, normalised to the total number of data entries for each sample group.
