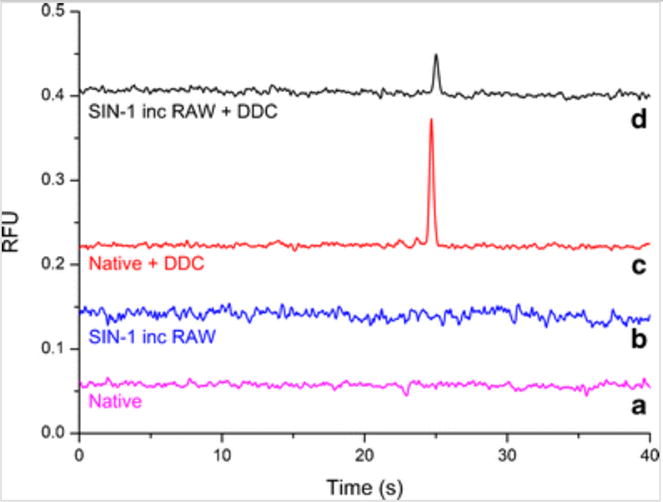
Fig. 5.

Electropherogram obtained for native and SIN-1 incubated RAW 264.7 macrophage cells. (a) Native RAW 264.7 macrophage cells, (b) SIN-1 incubated RAW 264.7 macrophage cells, (c) native RAW 264.7 macrophage cells in presence of DDC, (d) SIN-1 incubated RAW 264.7 macrophage cells in presence of DDC. Detection point = 4.5 cm from T intersection; n = 4
