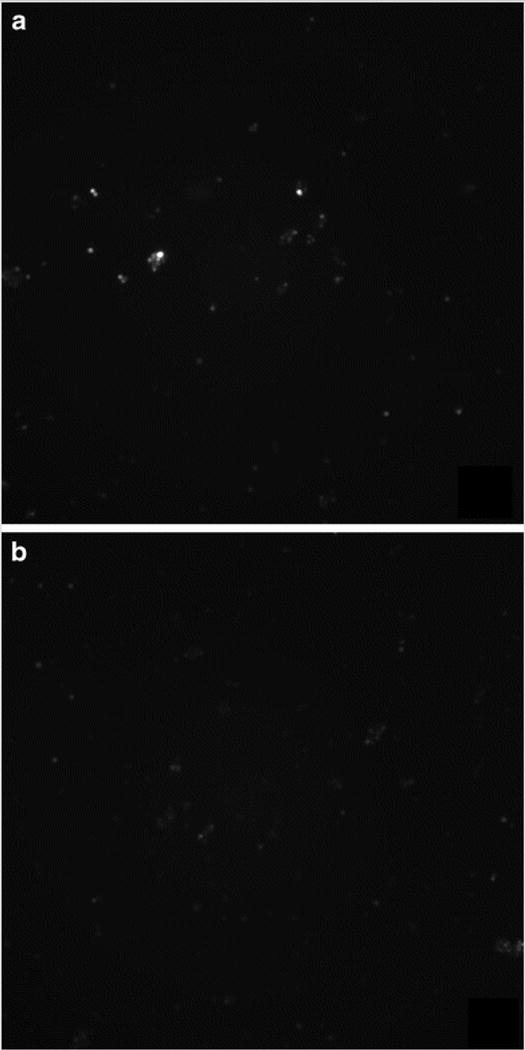
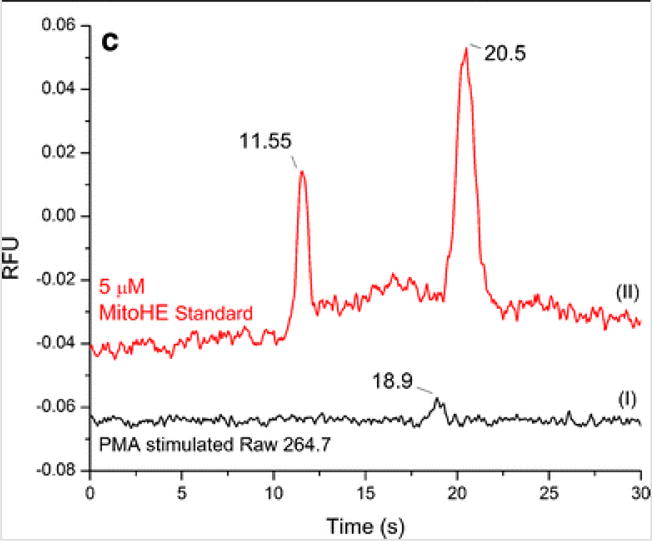
Fig. 6.


Stimulation optimization. RAW 264.7 macrophage cells were stimulated with 2 ng/mL PMA for 12 h and then incubated with 6 μL of 5 mM MitoHE for 10 min. a Fluorescence image of stimulated cells and b fluorescence image of native/control cells after stimulation protocol. c Electropherogram for (I) stimulated RAW 264.7 in comparison to (II) standard containing MitoE and 2-OH-MitoE. Detection point = 2.5 cm from T intersection
