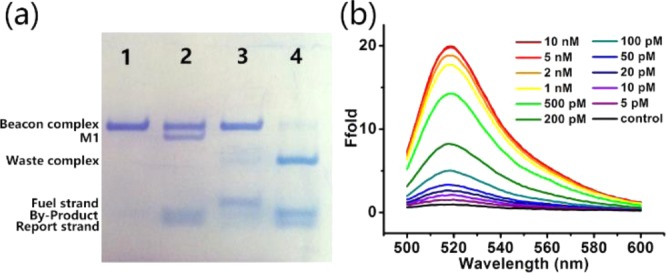
Figure 3.

Ebeacon-based amplified detection of nucleic acids. (a) Native PAGE of the entropy beacon system. Lane 1: B: 2 μM × 5 μL; lane 2: B: 2 μM × 5 μL + T: 20 μM × 0.5 μL; lane 3: B: 2 μM × 5 μL + F: 20 μM × 0.5 μL; lane 4: B: 2 μM × 5 μL + F: 20 μM × 0.5 μL + T: 2 μM × 0.5 μL (0.1×). Reaction time = 3 h. (b) Response of the Ebeacon probes to different concentrations of target DNA after incubation for 3 h. Concentration of the target DNA (from top to bottom of curve at 485 nm): 10 nM, 5 nM, 2 nM, 1 nM, 500 pM, 200 pM, 100 pM, 50 pM, 20 pM, 10 pM, 5 pM, control.
