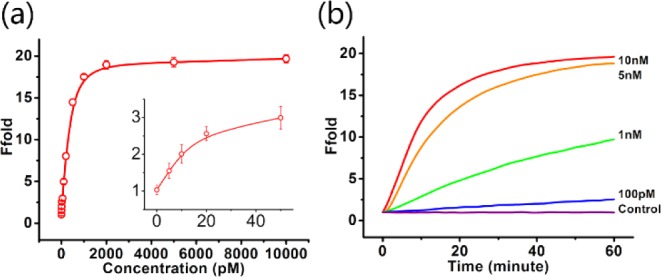
Figure 4.

Sensitivity of Ebeacon system for target DNA detection. (a) Calibration curve of the sensing system for target DNA. The curve was plotted with the initial rate of fluorescence enhancement vs DNA concentration. From bottom to top: 0 pM, 5 pM, 10 pM, 20 pM, 50 pM, 100 pM, 200 pM, 500 pM, 1 nM, 2 nM, 5 nM, and 10 nM. The inset shows the responses at low DNA concentrations. Error bars show the standard deviations of measurements taken from three independent experiments. (b) Fluorescence kinetics monitoring conversion of entropy beacon system to the waste strand and release of the reporter strand. No release is discernible in the absence of the target strand (control). However, rapid release of the reporter sequence is observed upon introducing 10 nM target strand. Substoichiometric target strand concentrations demonstrate turnover, with the conversion rate decreasing monotonically with target concentration.
