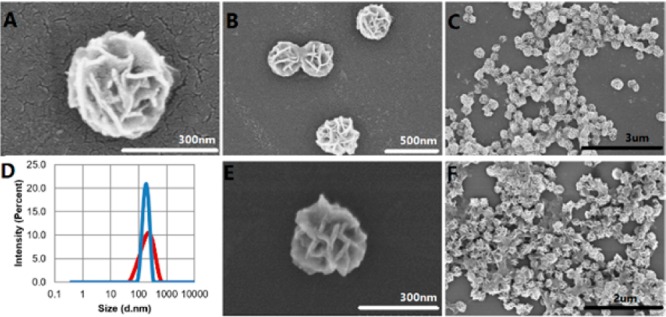
Figure 2.

Structural characterization of nuclease-resistant NFs. (A–C) SEM images showing structures of NFs at different scales. (D) DLS size distribution of NFs before (red) and after (blue) treatment with 5 U/mL of DNase I for 24 h at 37 °C. (E and F) SEM images showing structures of NFs after treatment with 5 U/mL of DNase I for 24 h at 37 °C.
