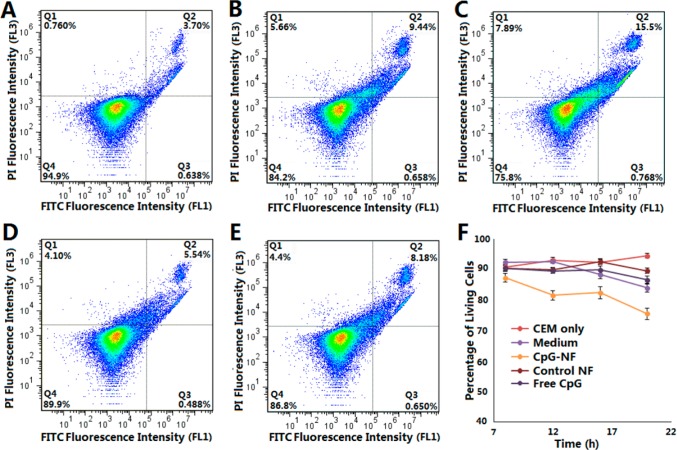
Figure 5.
Preliminary in vitro evaluation of the therapeutic effect of immunostimulatory CpG NFs on cancer cells. Flow cytometry results showing the percentage of living CEM cells with (A) no treatment and treatment with (B) RAW264.7 cells, (C) RAW264.7 cells and CpG NFs, (D) RAW264.7 cells and control NFs, or (E) RAW264.7 cells and free CpG for 20 h (bottom-left quadrant of each image showing the percentage of living cells). (F) Time-dependent curve showing the therapeutic efficacy of CpG NFs.

