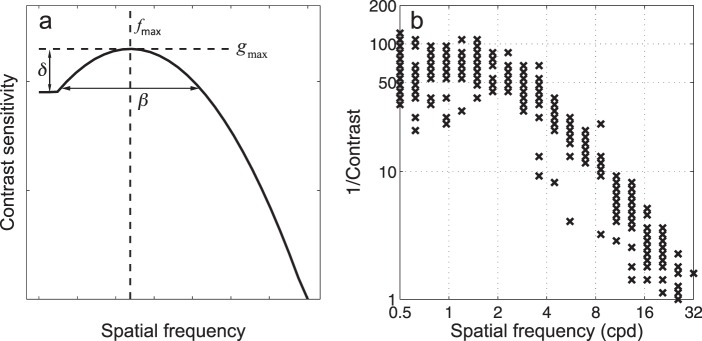
Figure A1.
The quick CSF method adopts a four-parameter truncated log parabolic functional form to describe the shape of the CSF (a) and selects the optimal test stimulus in each trial in the two-dimensional contrast and spatial frequency space. The history of stimulus selection of 300 quick CSF trials in a simulation study is shown in panel b. The coordinates of the “x” symbols represent the spatial frequency and contrast of the test stimuli.

