
Figure A2.
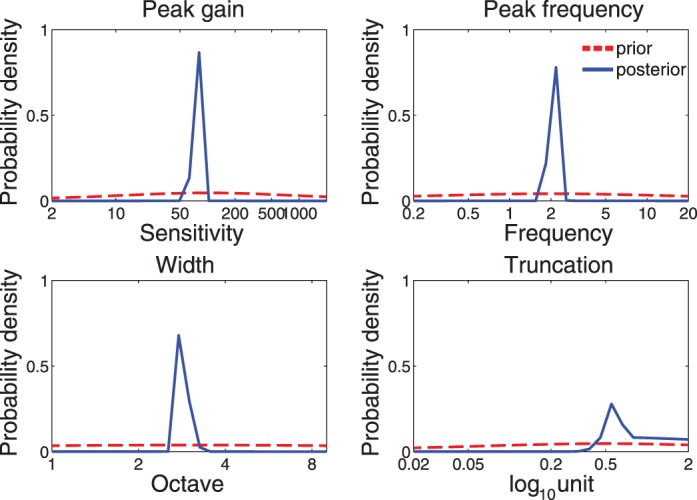
The marginal distributions of four parameters before (prior: red) and after (posterior: blue) measurement. The plot was based on the simulation of a single quick CSF run with 100 trials.
Official websites use .gov
A
.gov website belongs to an official
government organization in the United States.
Secure .gov websites use HTTPS
A lock (
) or https:// means you've safely
connected to the .gov website. Share sensitive
information only on official, secure websites.
The marginal distributions of four parameters before (prior: red) and after (posterior: blue) measurement. The plot was based on the simulation of a single quick CSF run with 100 trials.