
Figure B3.
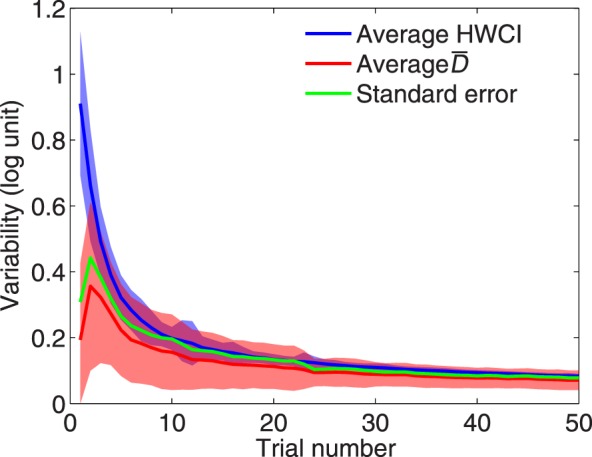
The average (over observers) HWCI (blue) and mean distance (red) of measured CSF are plotted as functions of trial number. The shaded area indicates ±1 SD for HWCI. The standard error of the estimated CSF is also plotted in green.
Official websites use .gov
A
.gov website belongs to an official
government organization in the United States.
Secure .gov websites use HTTPS
A lock (
) or https:// means you've safely
connected to the .gov website. Share sensitive
information only on official, secure websites.
The average (over observers) HWCI (blue) and mean distance (red) of measured CSF are plotted as functions of trial number. The shaded area indicates ±1 SD for HWCI. The standard error of the estimated CSF is also plotted in green.