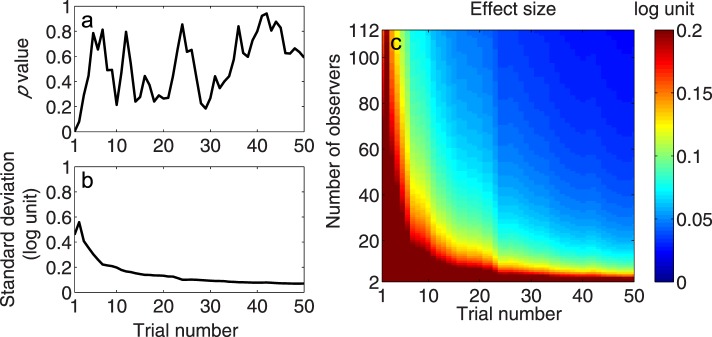
Figure 11.
(a) The p value of the Brown–Forsythe test as a function of trial number. All p values > 0.05 except for trial 1, signifying the same standard deviation of the AULCSF difference in all AULCSF comparisons. (b) The empirical standard deviation of population AULCSF difference as a function of trial number. (c) The effect size that can be detected by the quick CSF method with α = 0.05 and power = 0.95 as a joint function of observer and trial numbers.

