
Fig. 6.
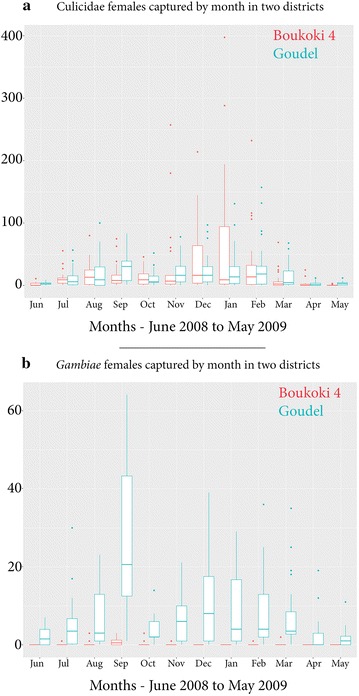
Monthly variation of mosquito abundance. Monthly variation of mosquito abundance showing different temporal dynamics for Anopheles gambiae (b) compared to the overall Culicidae (a) for the peri-urban district close to the river (Goudel) and the urban district close to the kori (Boukoki 4). Note the different y axis scales