
Fig. 11.
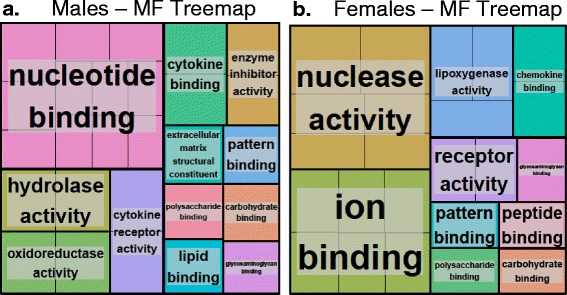
The enrichment of differentially expressed genes among molecular function category in mice exposed to CNC. Treemaps of DEGs in a males and b females generated using REVIGO. Each rectangle is a single cluster representative. The representatives are joined into ‘superclusters’ of loosely related terms, visualized with different colors. Size of the rectangles reflects either the p-value, or the frequency of the GO term in a given cluster. For more details please refer to methods section