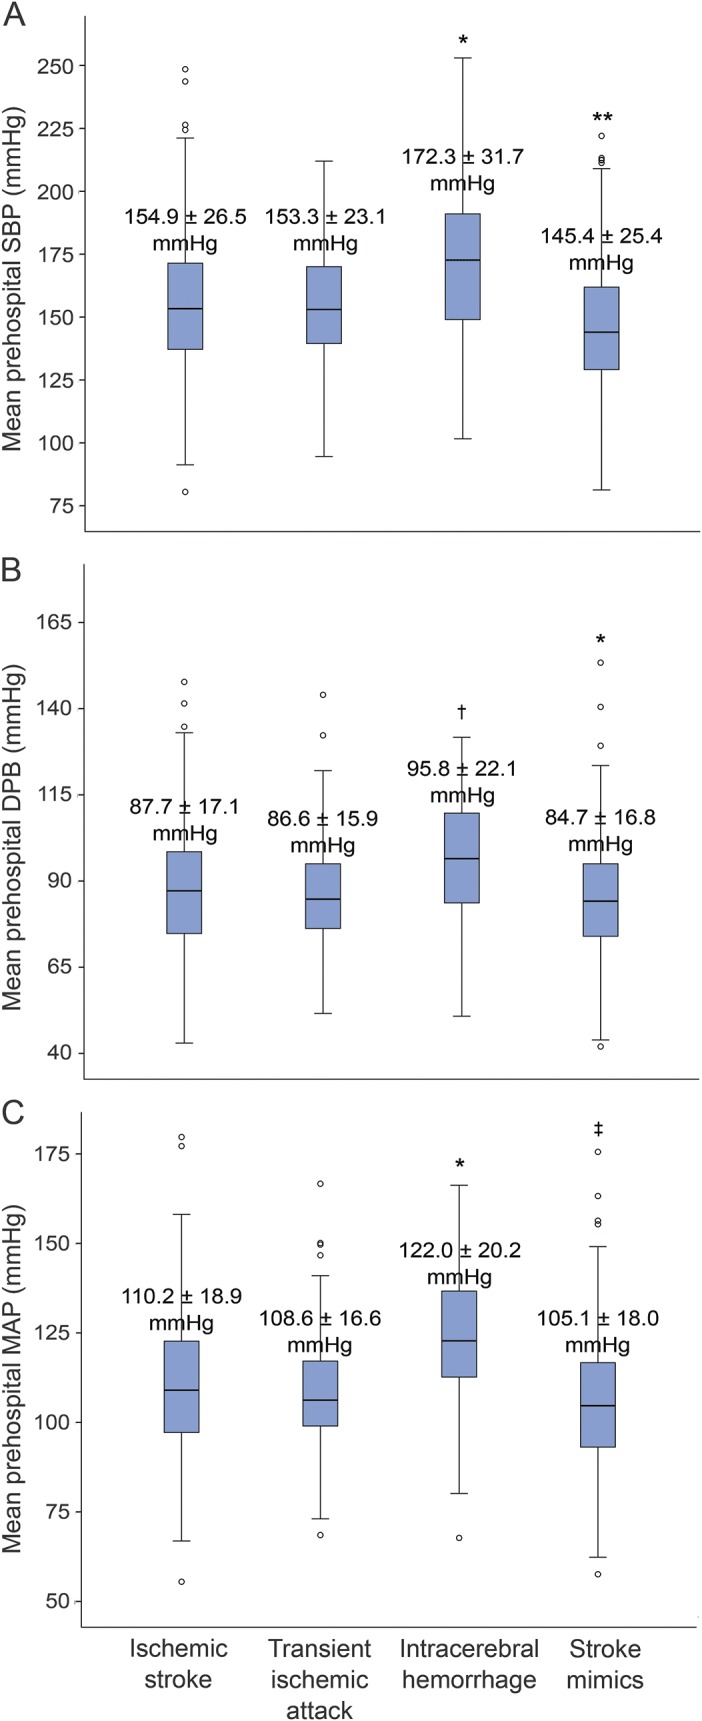
Figure 1. Relationship between mean prehospital blood pressure and final diagnosis.

Box-and-whisker plots of (A) mean prehospital SBP by diagnosis classification, (B) mean prehospital DBP by diagnostic classification, and (C) mean prehospital MAP by diagnostic classification. The p values were obtained by analysis of variance followed by Tukey post hoc test for independent comparisons between categories. *p < 0.001, †p < 0.01 for ICH compared to ischemic stroke, TIA, and stroke mimics. **p < 0.02 for stroke mimics compared to ischemic stroke, TIA, and ICH. ‡p ≤ 0.001 for stroke mimics compared to ischemic stroke and ICH. DBP = diastolic blood pressure; ICH = intracerebral hemorrhage; MAP = mean arterial pressure; SBP = systolic blood pressure.
