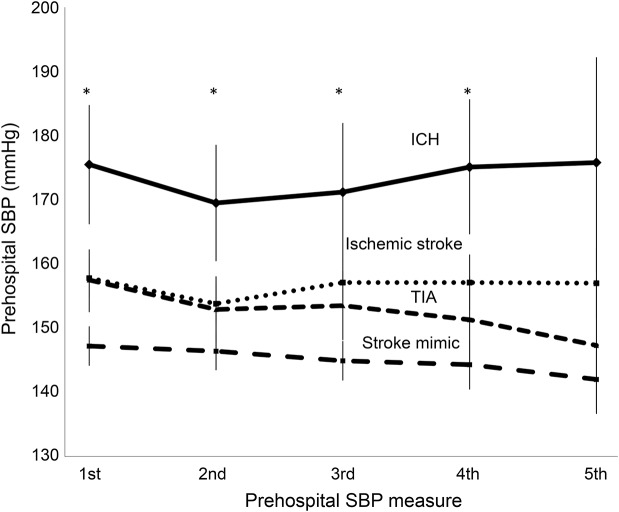
Figure 3. Natural history of prehospital SBP of patients with suspected stroke by diagnostic classification.
Linear plot of the natural history of prehospital SBP during emergency medical services transport by diagnostic classification. Error bars represent the 95% confidence interval of the mean. *p < 0.02 for ICH compared to ischemic stroke/TIA/mimics, except for the fifth prehospital measure between ICH and ischemic stroke (p = 0.06). ICH = intracerebral hemorrhage; SBP = systolic blood pressure.

