
Fig. 1.
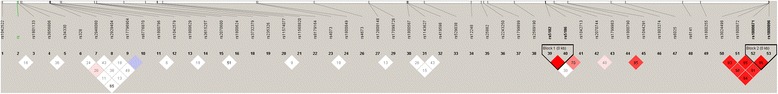
LD SNP plot. The LD is displayed according to standard color schemes, with bright red for very strong LD (LOD > 2, D’ = 1), light red (LOD > 2, D’ < 1) and blue (LOD < 2, D’ = 1) for intermediate LD, and white (LOD < 2, D’ < 1) for no LD
Official websites use .gov
A
.gov website belongs to an official
government organization in the United States.
Secure .gov websites use HTTPS
A lock (
) or https:// means you've safely
connected to the .gov website. Share sensitive
information only on official, secure websites.
LD SNP plot. The LD is displayed according to standard color schemes, with bright red for very strong LD (LOD > 2, D’ = 1), light red (LOD > 2, D’ < 1) and blue (LOD < 2, D’ = 1) for intermediate LD, and white (LOD < 2, D’ < 1) for no LD