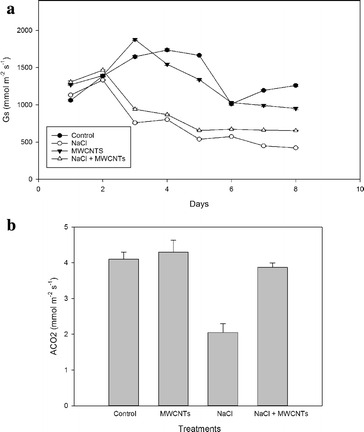
Fig. 3.

a Time-course of stomatal conductance (Gs) (mmol m−2 s−1) and b Net assimilation of CO2 (ACO2) (mmol m−2 s−1) in the leaves of broccoli plants and plants treated with 10 mg l−1 MWCNTs, 100 mM NaCl and 100 mM NaCl + 0.10 mg l−1 MWCNTs. Mean values ± standard errors are shown (n = 6). Bars with different letters are significantly different (P < 0.05) according to the Tukey test
