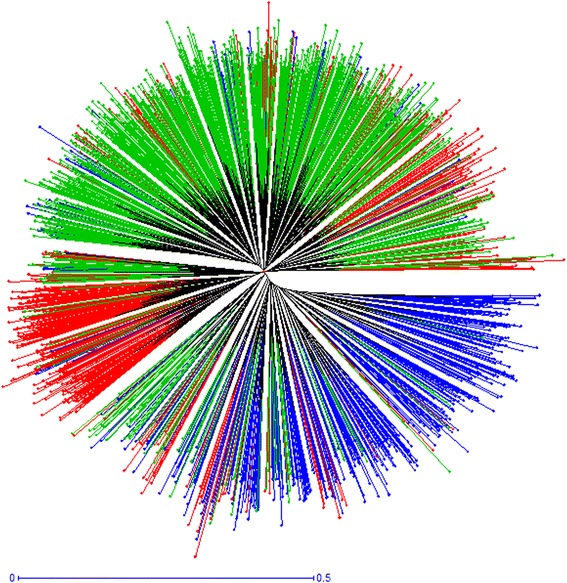
Fig. 3.

Neighbor-joining dendrogram based on simple matching dissimilarity matrix calculated from the dataset of 16 SSR markers for the 1859 genotypes clustered in the three groups revealed by the Bayesian model-based clustering method. The three groups are depicted using the following color codes: Red = group K1; Blue = group K2; Green = group K3
