
Fig. 2.
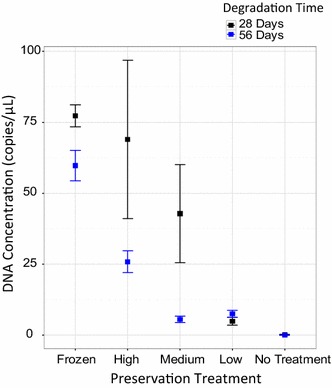
Average concentration of DNA measured per treatment (copies/μL) at 28 days (black) and 56 days (blue) showing the performance of Longmire’s buffer treatment at preserving DNA. Shown are averages for frozen positive control, high, medium, and low concentrations of Longmire’s, and the no treatment negative control (Calculated from values in Additional file 1). Note that the 28 days mean for “No Treatment” is directly under the 56 days mean as they are nearly equal. Symbols represent the mean and error bars are the mean ± 1SE