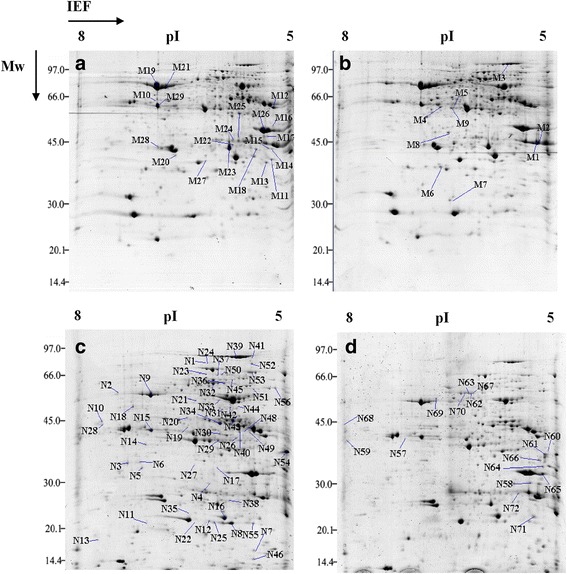
Fig. 2.

Comparison 2-DE protein gel maps taken from Qi319 and Qi319-96 maize leaves that had been subjected to two different phosphorus concentrations. The proteins were extracted by TCA/acetone from the middle of the fourth leaf and the 1.2 mg protein samples were separated in IEF using 17 cm pH 5–8 IPG strips. Then they were put on a 12 % polyacrylamide gel for the second dimensional separation and stained with CBB. The gel image analysis was carried out using PDQuest software (version 7.2.0; Bio-Rad). The spots marked with numbers (M1–M29) indicated proteins that were differentially accumulated in leaves of Qi319-96 and Qi-319 under + P conditions identified by MALDI-TOF MS; The spots marked with numbers (N1-N72) indicate proteins that were differentially accumulated in leaves of Qi319-96 and Qi-319 under -P conditions identified by MALDI-TOF MS. a: the image of the + P treatment Qi319-96 protein; b: the image of the + P treatment Qi319 protein; c: the image of the –P treatment Qi319-96 protein; d: the image of the –P treatment Qi319 protein
