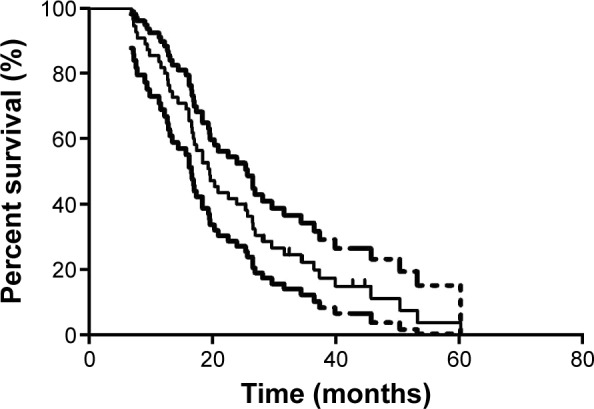
Figure 1.

Kaplan–Meier curves of overall survival in all patients (N=55).
Note: Dashed lines are upper bound and lower bound, respectively, of 95% CI of Kaplan–Meier estimates.
Abbreviations: CI, confidence interval; OS, overall survival.

Kaplan–Meier curves of overall survival in all patients (N=55).
Note: Dashed lines are upper bound and lower bound, respectively, of 95% CI of Kaplan–Meier estimates.
Abbreviations: CI, confidence interval; OS, overall survival.