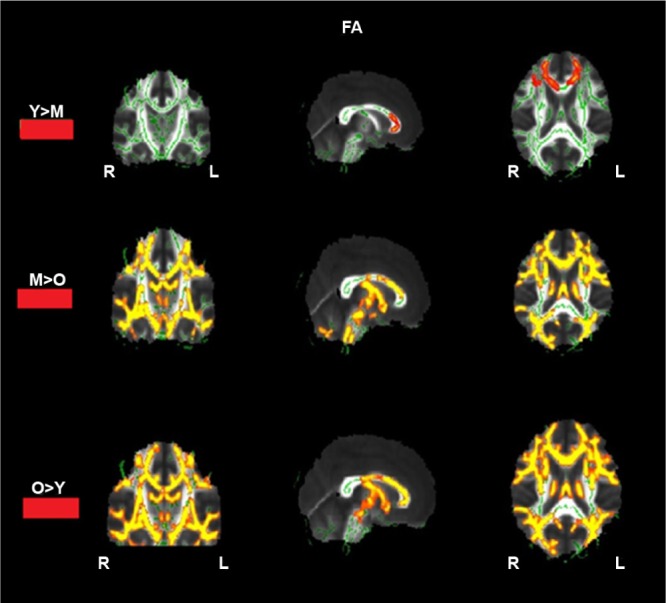
Figure 5.

Statistical maps showing white matter clusters (red) where FA was significantly greater in young-aged > middle-aged adults, middle-aged > old-aged adults, old-aged > young-aged adults.
Abbreviations: FA, fractional anisotropy; R, right; L, left.
