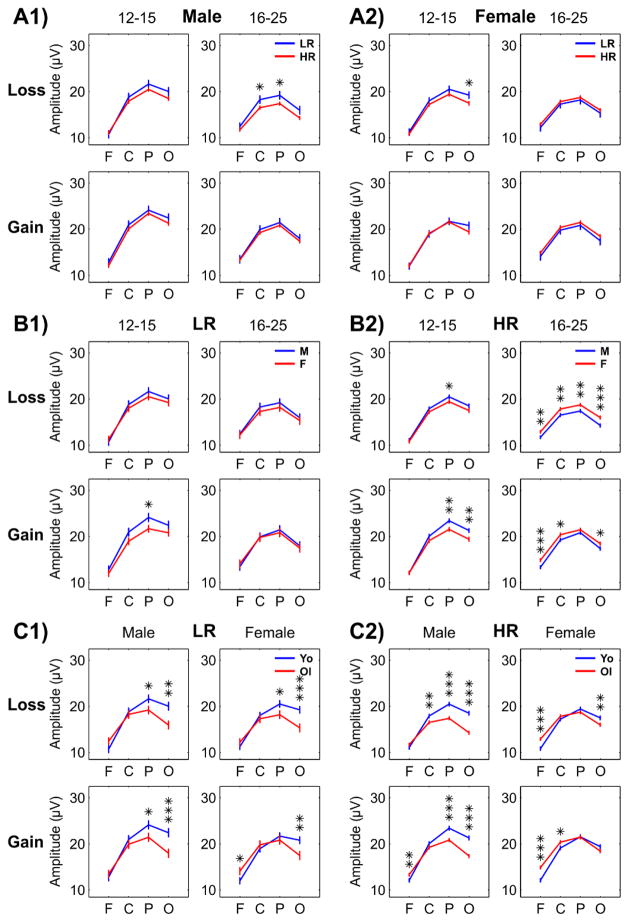
Fig. 4.
Multiple comparisons across different groups during loss and gain conditions. Estimated marginal means and standard error (±1 SE) of pairwise comparisons between the levels of risk groups (panel-sets A1 and A2), gender (panel-sets B1 and B2), and age groups (panel-sets C1 and C2) in loss and gain condition have been plotted for each scalp region (F: frontal; C: central; P: parietal; and O: occipital). Bonferroni adjusted level of significance for each comparison is shown in asterisks (*p < 0.05, **p < 0.01, ***p < 0.001).

