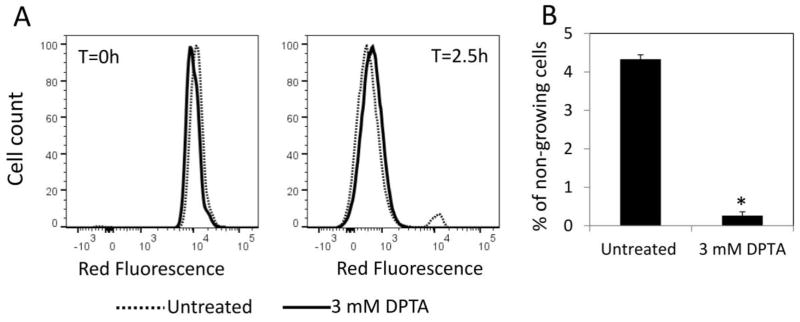
Figure 3. Quantification of non-growing cell population after NO treatment.
Cell cultures grown in LB with 1mM IPTG to induce mCherry protein were treated with 3 mM DPTA at t=4 h. For control groups (untreated), solvent was added to cultures. At t=24 h, cells were washed and diluted in fresh LB without inducer, and cultured for 2.5 h. A. mCherry at single cell level was determined by flow cytometry. At t=2.5 h mCherry levels were reduced in growing cells due to cell division, whereas it remained constant in non-growing cell populations. B. Percentages of non-growing cell populations in untreated or DPTA-treated cultures were determined at t=2.5 h. * indicates a statistical difference between untreated and DPTA treated groups (P-value<0.05, t-test). At least three biological replicates were performed for each experimental condition. Each data point represents the mean value ± standard error.

