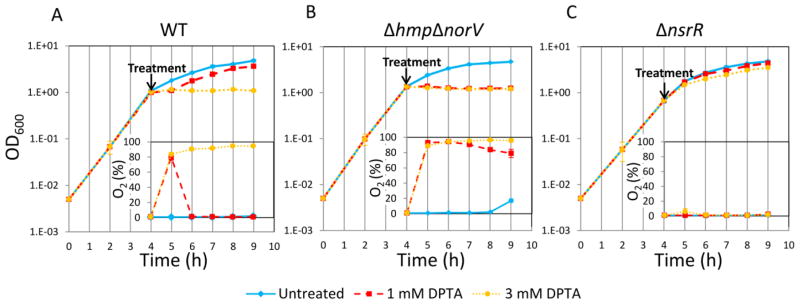
Figure 7. Growth and oxygen consumption of WT, ΔhmpΔnorV, and ΔnsrR following NO treatment.
Cell cultures at t=4 h were treated with DPTA at indicated concentrations. A. Cell growth and oxygen utilization of WT were monitored at indicated time points. B. Cell growth and oxygen utilization of ΔhmpΔnorV were monitored at indicated time points. C. Cell growth and oxygen utilization of ΔnsrR were monitored at indicated time points. At least three biological replicates were performed for each experimental condition. Each data point represents the mean value ± standard error.

