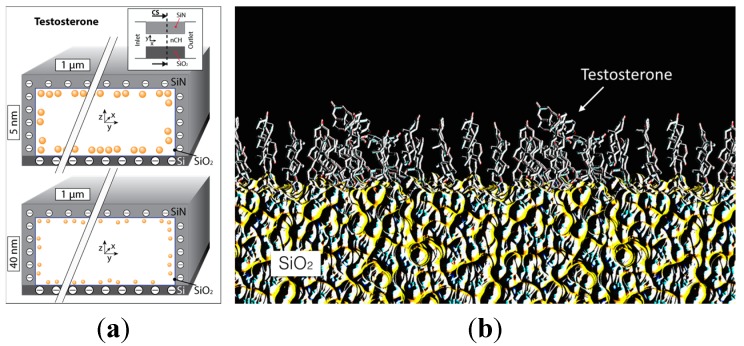
Figure 6.
(a) Cross section of a nanochannel highlighting the testosterone distribution during its release across 5 and 40 nm nanochannels membranes. Please note that the aspect ratio was lessened for better visual representation of the molecular distribution; (b) Testosterone single monolayer on a silica (SiO2) surface.

