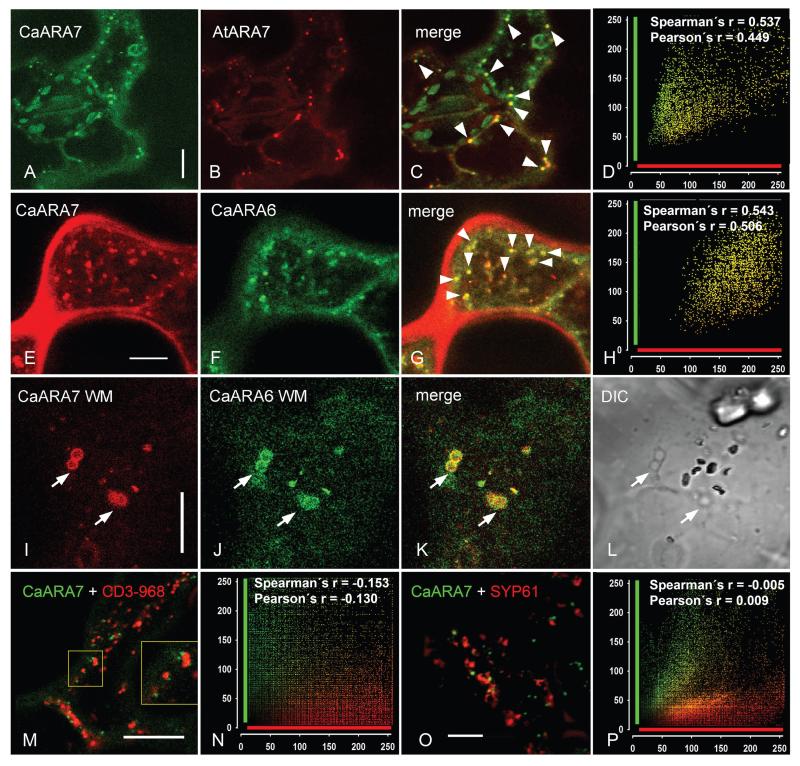
Figure 6. Transient co-expression of CaARA7 with organelle markers in epidermal cells of control untreated tobacco leaves and in epidermal cells of leaves infiltrated with wortmannin (WM).
A–D) In untreated cells the fluorescence of GFP-CaARA7 labelled organelles (A) frequently overlaps with the fluorescence of mCherry-AtARA7-labelled particles (B). Arrow heads in the merged image (C) indicate colocalizations; (D) is the corresponding scatter plot. E–H) Colocalization of mCherry-CaARA7 with CaARA6-GFP in control untreated epidermal cells of tobacco leaves (arrow heads in the merged image (G); (H) is the corresponding scatter plot). I–L) WM compartments (arrows) carry both mCherry-CaARA7 (I) and CaARA6-GFP (J). K) Is the merged image. Note characteristic WM compartments in the corresponding DIC image (L). M and N) Co-expression of wild-type GFP-CaARA7 (green) with the Golgi marker CD3-968-mCherry (red) (M, merged image) and cumulative scatterplot (N) show no colocalization. O and P) Co-expression of wild type green fluorescent GFP-CaARA7 with the red fluorescent TGN marker SYP61-mRFP (O, merged image) and cumulative scatterplot (P) illustrate lack of colocalization. Bars are 10 μm.

