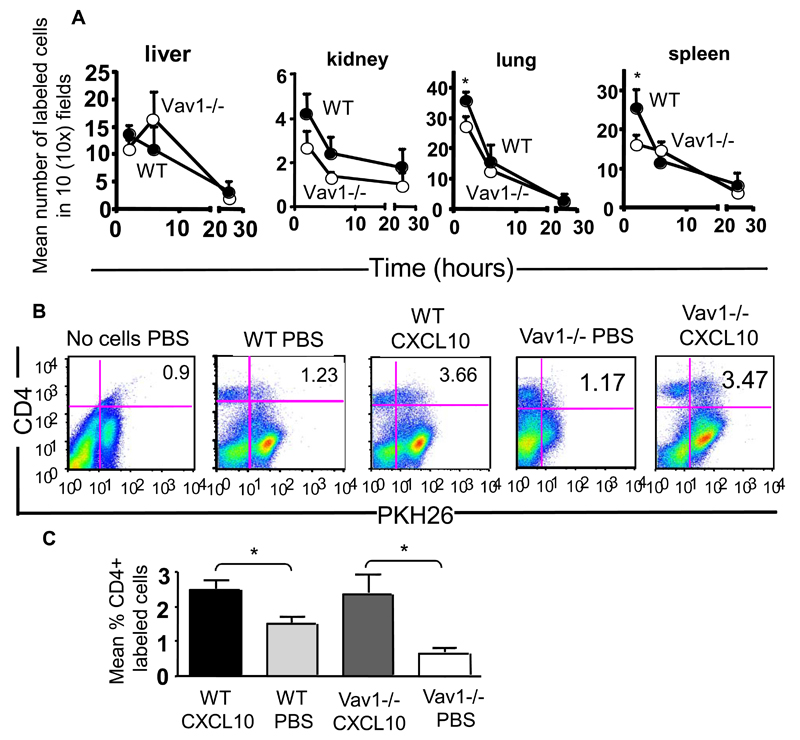
Figure 2. Constitutive and chemokine Vav1-/- effector T-cell trafficking in vivo.
Panel A: HY-specific CD4+ WT and Vav1-/- T cells were labeled with PKH26 (red) or CFSE (green) respectively and injected iv in syngeneic female mice. Trafficking into kidney, liver, lung and spleen was monitored at 2, 6 and 24 hours post-injection by harvesting, snap-freezing the tissue and taking 5-10μm sections. The mean number of cells from at least six tissue sections from at least three was quantified by wide-field fluorescence microscopy as described in Materials and Methods. Panels B and C: WT and Vav1-/- T were labeled with PKH26 and injected iv into syngeneic female mice that had received an ip injection of 1.2 μg CXCL10. Some mice were also injected with PBS alone (i.e. no T cells) as an autofluorescence control. Mice were sacrificed 16 hours later, and the presence of PKH26-labeled, CD4-positive T cells was analysed by flow cytometry. Representative dot plots are shown in panel B. The mean percentage of cells present in the peritoneal lavage (calculated by subtracting the average background migration) from the percentage of migrated cells in the presence of CXCL10 is shown in panel C. Owing to the presence of an autofluorescent population of non-T cells often detected in FL-2 (also in control mice that received saline solution), cells were double-stained with an APC-conjugated anti-CD4 antibody following harvesting and the percentage of PKH26 (FL-2)-labeled T cells gated in the CD4+ T cell population is shown in the histogram and the graph representing cumulative data from at least three animals. The mean ± SEM observed in samples from at least three animals are shown. Standard errors are shown (*p<0.05).

