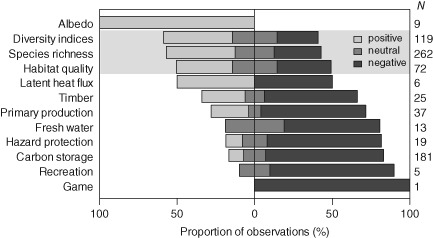
Figure 3.

Disturbance effects on indicators of ecosystem services and biodiversity (shaded). Bars show the distribution of positive, neutral and negative disturbance effects per indicator; N denotes the total number of observations. Note that neutral and mixed effects were subsumed under the neutral category here, and that findings based on expert opinions were excluded.
