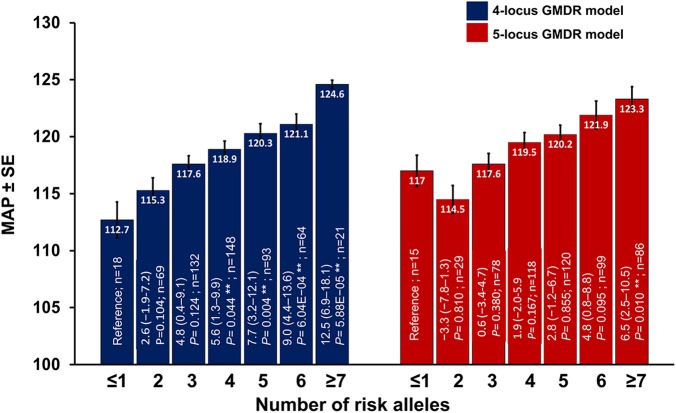
Figure 4.
Influence of the increasing number of risk alleles in the 4-locus and 5-locus best generalised multifactor dimensionality reduction (GMDR) model on clinical parameters. n, number of cases in each classified risk alleles. Inset in bars represents correlation coefficient (β) at 95% CI after adjustment for age, gender, smoking, alcohol, triglyceride and cholesterol, and Bonferroni's correction for multiple testing and p value. The general linear model was used to calculate β and p values. MAP, mean arterial pressure.

