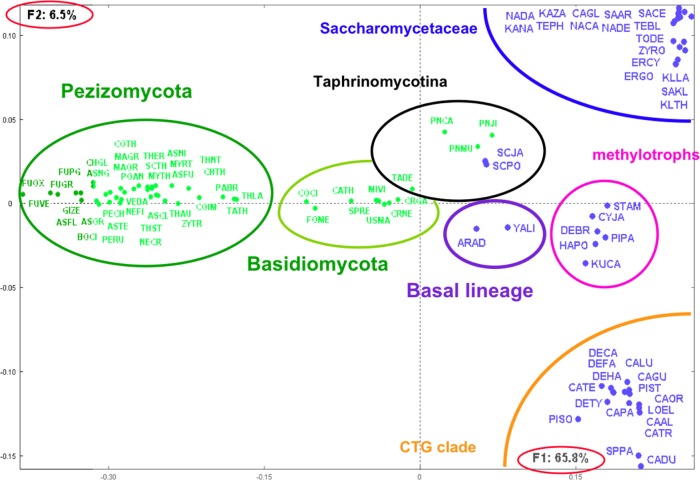
Figure 3.
Distribution of yeast and fungal species as obtained from their shared orthologs.
Notes: This figure illustrates the first factorial plan as obtained by CA and representing 72% of the total information included in the matrix of similarity scores between species (see text). Species identification follows Table 1. Yeast (blue points) and fungal (green points) species distributions correspond to the major subdivisions defined from global comparisons. Note the clear-cut segregation between fungal and yeast species.

