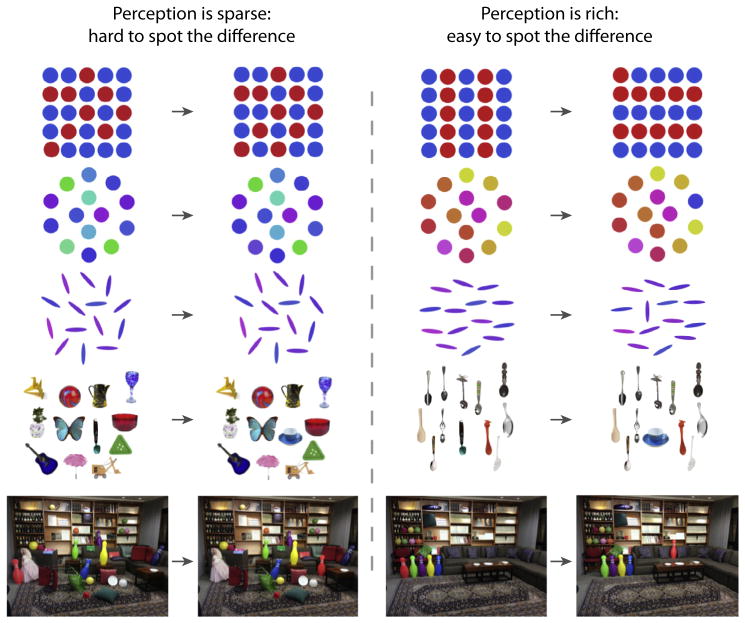
Figure 2. Change Blindness Demonstrations Are often Cited as Evidence that Perception Is Limited to just a few Items.
The left two columns show five examples of displays in which detecting the change between them is difficult. However, the right two columns show five examples of displays in which detecting the change is trivially easy. Critically, the amount of change on each row is identical in both the left and right image pairs. The changes on each row are: (i) a red dot changes to a blue dot; (ii) a color changes by 90° on the color wheel; (iii) a blue oval rotates 90°; (iv) a spoon changes into a tea cup; and (v) the red bowling pin changes location. The key point is that, when the changes between the displays preserve certain statistics (left columns), the change is hard to notice. However, when the changes violate those statistics (right column), the change is easy to notice and highlights the vast amount of information observers have access to at a given instant.

