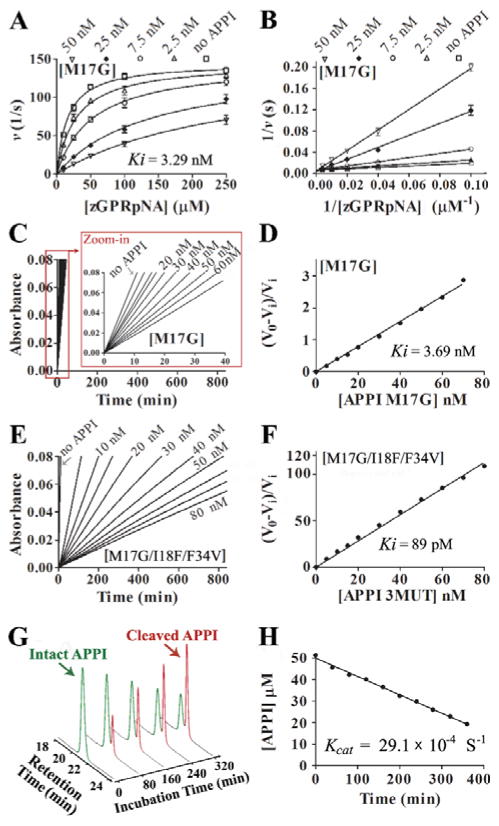
Figure 3. Kinetics of mesotrypsin inhibition by APPI and hydrolysis of APPI by mesotrypsin.
(A) Competitive patterns of mesotrypsin inhibition by APPIM17G. Mesotrypsin cleavage of peptide substrate Z-GPR-pNA is competitively inhibited by APPIM17G. (B) The Lineweaver-Burk double reciprocal transform of the data used in panel A. The APPI (inhibitor) concentration is given at the top of each plot; the mesotrypsin concentration was 0.25 nM. Data was fitted globally to the competitive inhibition equation using Prism, GraphPad Software. (C, E) Slow, tight binding inhibition of mesotrypsin by APPI variants. Steady-state equilibrium for the reactions of APPIM17G (C) and APPIM17G/I18F/F34V (E) with various concentrations of APPI and 145 μM of peptide substrate Z-GPR-pNA. (D, F) A re-plot of slopes (V0 and Vi) calculated from the binding curves shown in panels C and E, respectively, where V0 is the uninhibited rate and Vi is the rate in the presence of inhibitor, which allows calculation of Ki using eq. 2 (as described in SI Materials and Methods under “ Inhibition studies”). (G) Kinetics of APPIM17G/I18F/F34V hydrolysis by mesotrypsin. Representative HPLC chromatograms are shown from a time course of APPIM17G/I18F/F34V hydrolysis by mesotrypsin. Green and red peaks represent intact and cleaved inhibitor, respectively. (H) Initial rate of hydrolysis, from which kcat is calculated. Disappearance of intact APPIM17G/I18F/F34V was quantified by integration of the HPLC peak in a time course that is illustrated in panel G. Hydrolysis reaction contained 50 μM of APPIM17G/I18F/F34V and 2.5 μM of enzyme.

