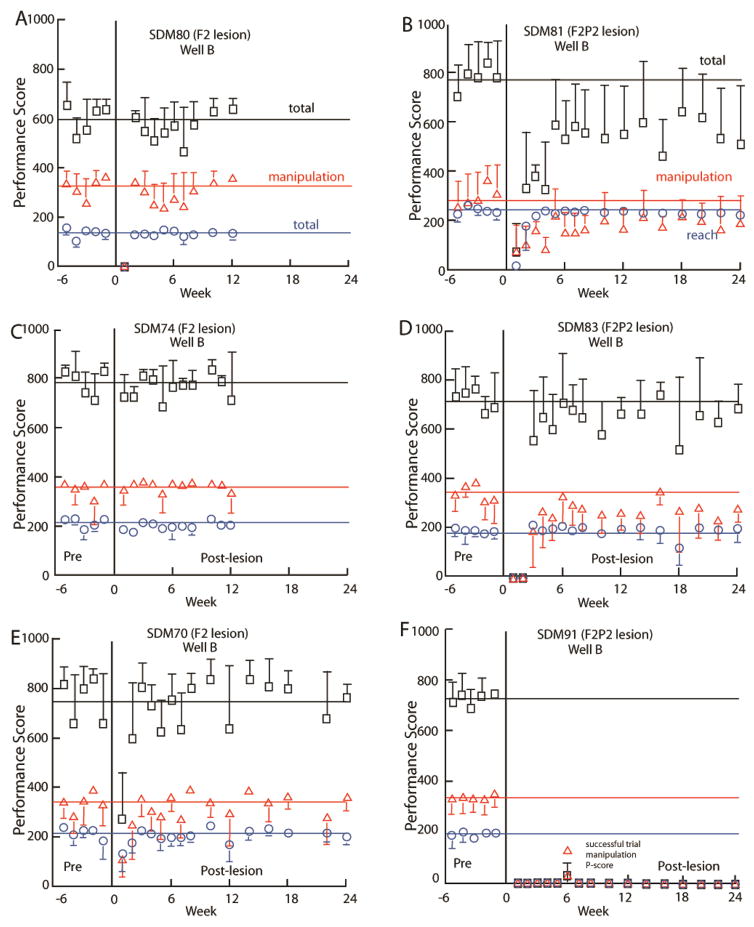
Figure 6.
Pre- and post-lesion performance scores in the mDB well B task by 6 monkeys – 3 with F2 lesions (A, C, E) and 3 with F2P2 lesions (B, D, F). Total, reach and manipulation performance scores are shown. The horizontal lines represent average scores from the last 5 pre-lesion tests. Each plotted point is the average performance score for 5 trials to well B. Error bars are 1 S.D. Note that F includes the score for a successful trial by SDM91 on well B at post-lesion week 6.

