
Figure 9.
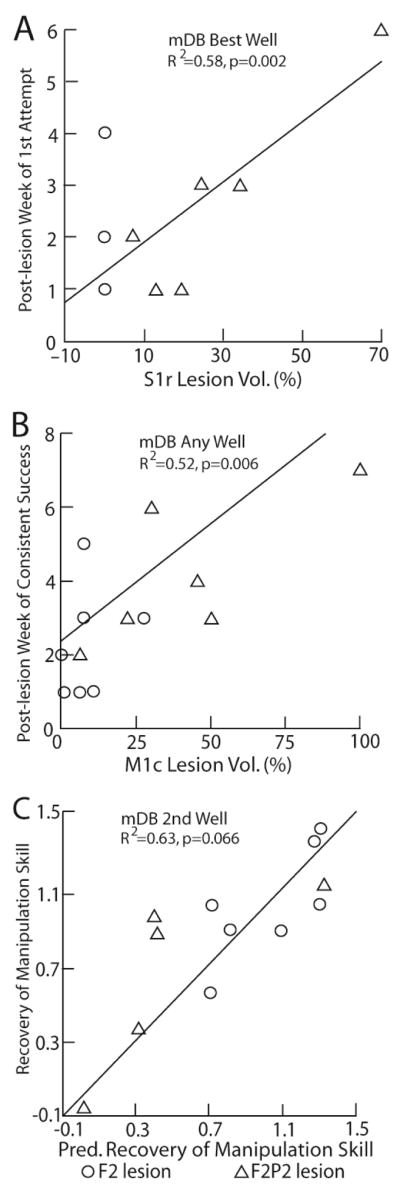
Scatterplots of post-lesion week of first attempt versus percentage of S1r arm/hand area lesion volume in the mDB best well task (A), of post-lesion week of consistent success (on all trials in any well) versus percentage of M1c arm/hand area lesion volume (B) and recovery of manipulation skill on the 2nd well versus vs predicted recovery of manipulation (C). Each plotted point is data from a single monkey with a F2 (circle) or F2P2 (triangle) lesion. Predicted recovery of manipulation skill in C is from the best fit forward stepwise multiple regression model (equation: = 0.045 x S1rLV% - 0.0085xLPMCLV + 0.017xM1cLV% + 0.006*PELV + 1.682).