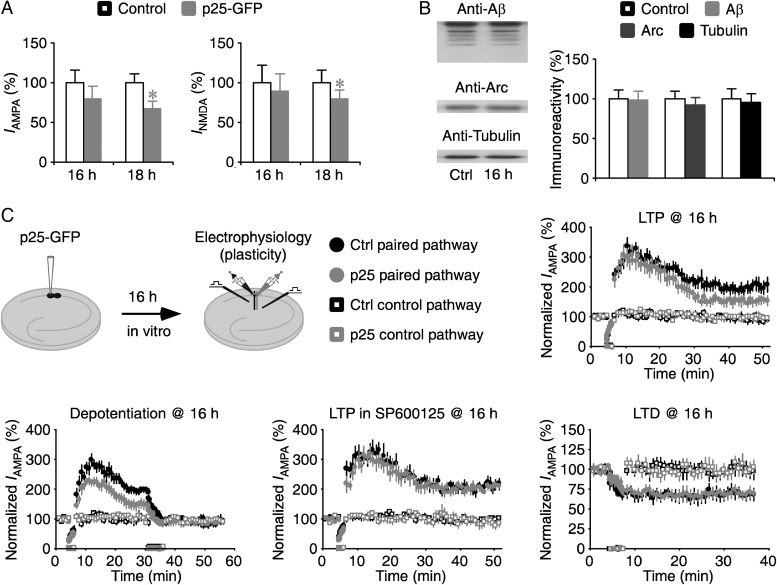
Figure 5.
Acute overproduction of p25 stimulates depotentiation. (A) Overexpression of p25-GFP for 18 h, but not 16 h, induced significant depressions in AMPA and NMDA responses in p25-GFP expressing neurons. Values for AMPA (Ctrl: −21.5 ± 3.5 pA; Exp: −17.2 ± 3.3 pA; n = 20; P = 0.28) and NMDA (Ctrl: 62.0 ± 13.7 pA; Exp: 55.6 ± 12.9 pA; n = 20; P = 0.79) responses in neurons after 16-h overexpression of p25-GFP (see Fig. 1C for the values for those after 18 h of overexpression of p25-GFP). Note no significant difference in the relative depressions after 16 and 18 h of overexpression of p25-GFP (16-h: 20.0%; 18-h: 33.4%; P = 0.21; Mann–Whitney Rank Sum test). AMPA-R and NMDA-R mediated current amplitudes and standard errors were normalized to average values from control cells. (B) (Left) Expression of Aβ, Arc and tubulin after 16-h overexpression of p25 in CA1 cells. (Right) Relative amounts of Aβ (Ctrl: 100.0 ± 10.7%; 16-h: 98.5 ± 11.1; n = 14, P = 0.71), Arc (Ctrl: 100.0 ± 8.7%; 16-h: 92.5 ± 8.6; n = 14, P = 0.33), and tubulin (Ctrl: 100.0 ± 12.6%; 16-h: 95.0 ± 11.1; n = 14, P = 0.88) in p25-expressing cells compared with control nonexpressing CA1 cells. (C) (Upper left) Schematic drawing outlines in vitro plasticity experimental design. Relative LTP, depotentiation, LTP in SP600125, and LTD in expressing neurons compared with control nonexpressing neurons after 16-h overexpression of p25. Values for the potentiation and depression between control nonexpressing neurons and p25-expressing neurons in LTP (Ctrl: 199.0 ± 15.7%; Exp: 154.1 ± 11.9%; n = 18; P < 0.005 for paired pathways; Ctrl: 94.2 ± 8.6%; Exp: 97.5 ± 5.6%; n = 18; P = 0.93 for control pathways), depotentiation (Ctrl: 99.3 ± 7.4%; Exp: 59.9 ± 10.6%; n = 14; P < 0.05 for paired pathways; Ctrl: 96.3 ± 5.1%; Exp: 93.2 ± 6.3%; n = 14; P = 0.78 for control pathways), LTP in SP600125 (Ctrl: 207.3 ± 10.2%; Exp: 204.1 ± 9.7%; n = 14; P = 0.88 for paired pathways; Ctrl: 95.3 ± 11.5%; Exp: 98.1 ± 4.8%; n = 14; P = 0.55 for control pathways), and LTD (Ctrl: 68.3 ± 5.0%; Exp: 69.8 ± 4.2%; n = 18; P = 0.74 for paired pathways; Ctrl: 100.4 ± 3.4%; Exp: 100.8 ± 4.1%; n = 18; P = 0.65 for control pathways) after 16-h overexpression of p25. Asterisks indicate P < 0.05 (Wilcoxon tests).

