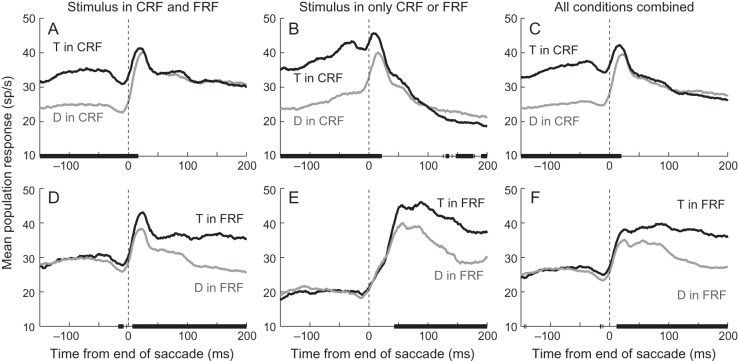
Figure 4.
Responses from the population of 52 neurons sorted by stimulus identity in the CRF or FRF. The top row shows the mean responses when a target (black traces) or distractor (gray traces) was in the CRF averaged from saccades in which there was a stimulus in both the CRF and FRF (A), from saccades in which there was no stimulus in the FRF (B) and from all saccades (C). The bottom row shows the mean responses when a target (black traces) or distractor (gray traces) was in the FRF averaged from saccades in which there was a stimulus in both the CRF and FRF (D), from saccades in which there was no stimulus in the CRF (E) and from all saccades (F). Black bars on the x-axes indicate the times at which the 2 traces were significantly different (P < 0.01, Wilcoxon Sign Rank test). Vertical dashed lines indicate the end of the saccade.

