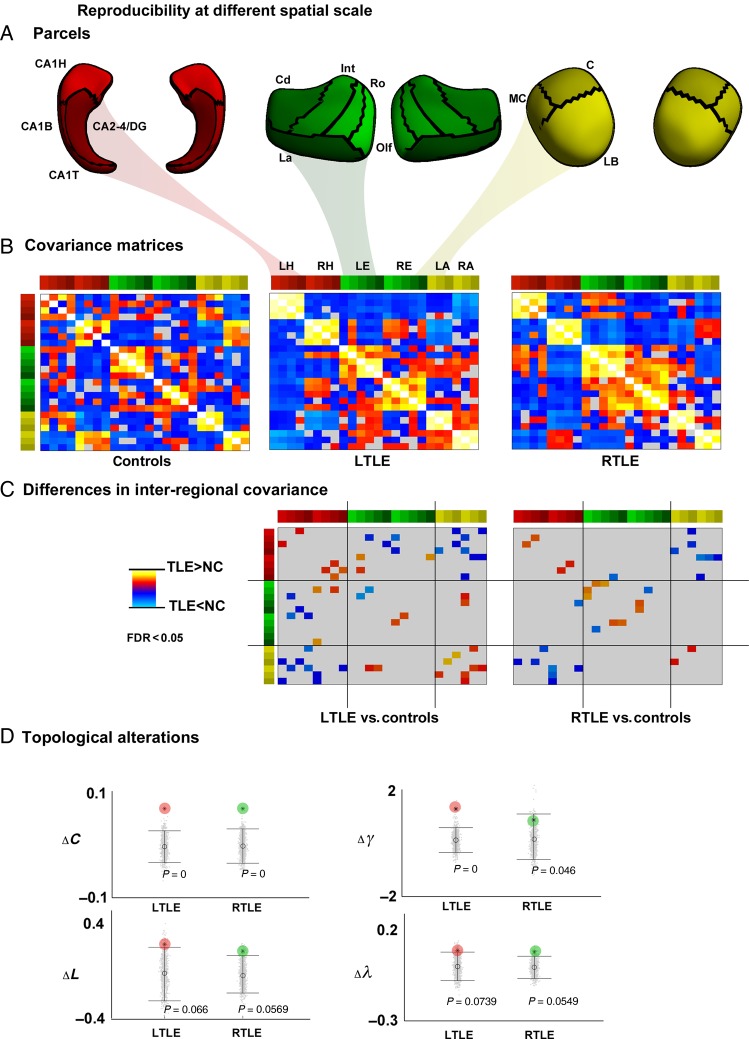
Figure 4.
Findings based on low-resolution (24 ROI) parcellation. (A) Parcellation. (B) Structural covariance matrices in controls, LTLE, and RTLE. (C) Inter-regional covariance differences between patients and controls. Increases/decreases in patients relative to controls are shown in red/blue, corrected at FDR <0.05. (D) Differences in clustering (ΔC), normalized clustering (Δγ), path length (ΔL), and normalized path length (Δλ) between patients and controls. For details on color bars, please see Figure 1 legend.

