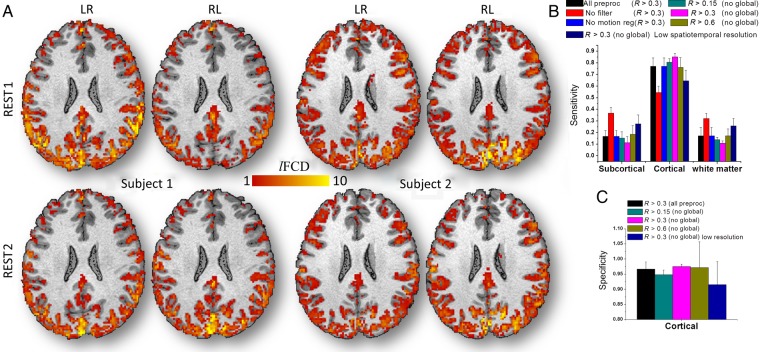
Figure 2.
GM sensitivity and specificity across subjects. (A) Four exemplary lFCD maps from test–retest sessions (REST1 and REST2) with different multiband acquisition (phase-encoding directions: LR and RL) for 2 randomly selected subjects, superimposed on the subjects' T1-weighted MRI structures. Average sensitivity for subcortical and cortical GM and white matter (B) and specificity (C) of lFCD across subjects for each of the processing pipelines in Figure 1, for REST1 and LR phase encoding. Error bars are standard deviations.

