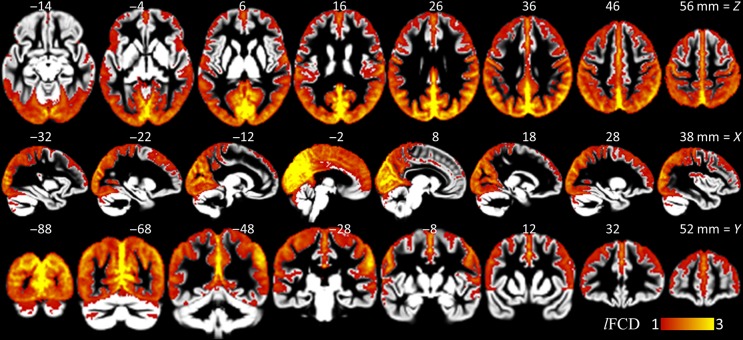
Figure 4.
lFCD patterns. Average lFCD strength across subjects showing brain areas with higher lFCD than the whole brain average (pipeline 1), superimposed on axial (top row), sagittal (middle row), and coronal (bottom row) views of cortical and subcortical GM template developed using the HCP structural scans.

