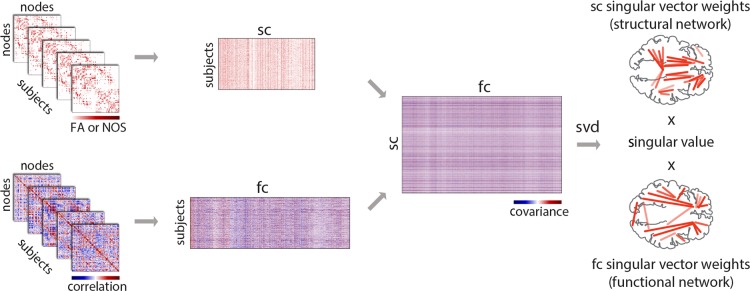
Figure 1.
PLS analysis. SC and FC data matrices were organized by stacking the upper triangle elements from individual participants' matrices to form two new matrices. The rows of these matrices correspond to participants, and columns correspond to either structural or functional connections. Structural connections that were zero-valued for all participants were removed, and the remaining data were z-scored columnwise. The covariance between structural and functional connections was computed across participants, resulting in a rectangular SC–FC covariance matrix. The SC–FC covariance matrix was then subjected to singular value decomposition (SVD), resulting in a vector of weights for all structural connections (interpreted as a structural network), a vector of weights for all functional connections (interpreted as a functional network) that optimally covary with each other. Each SC–FC pattern was associated with a scalar singular value, which indicates the proportion of SC–FC covariance accounted for by the extracted structural and functional networks.

