
Figure 5.
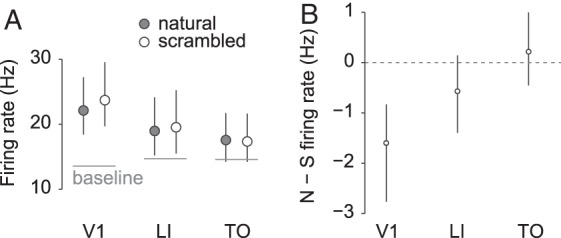
Firing rates per area. Panel A shows average (across trials, stimuli, and neurons) response strength to natural (gray markers) and scrambled (white markers) movies per area, with the average baseline firing rate indicated by a horizontal line. Error bars indicate the 95% CI's calculated by BCa. Panel B shows the average difference in response strength to natural and scrambled movies per area. Negative values indicate a stronger response to scrambled versions of the movies. Error bars indicate the 95% CI's calculated by BCa.