Fig 2.
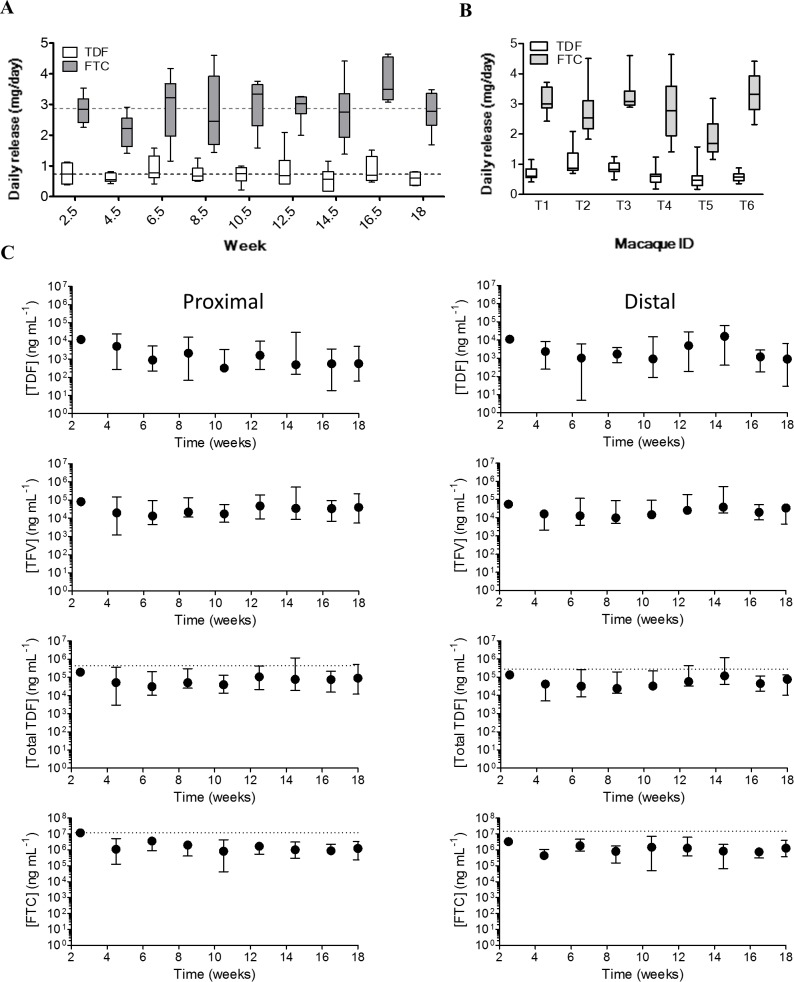
Pod-IVR Pharmacokinetics in macaques (A) In vivo release of TDF and FTC from each pod-IVR (N = 6/time point) over the course of the efficacy study determined by residual drug measurements from the pod-IVRs that were in place for 19 weeks with IVRs exchanged for new devices every 2 weeks. The top and bottom of the boxes show the 75th and 25th percentiles, respectively, and the line in the middle of the box is the median value. The dotted lines show the mean (N = 6) in vivo release from identical pod-IVRs obtained during the PK study preceding this efficacy study [26]. (B) In vivo release profile for individual macaques (T1-T6) shows variability between animals. (C) TDF, TFV, TDF+TFV, and FTC levels in vaginal fluids collected at each ring exchange. Vaginal fluids were collected with Weck-Cel sponges proximal and distal to the pod-IVR placement. The dotted horizontal lines correspond to the medians from our previous PK study [26]. Left panels-proximal; Right panels-distal; Dots-median.

