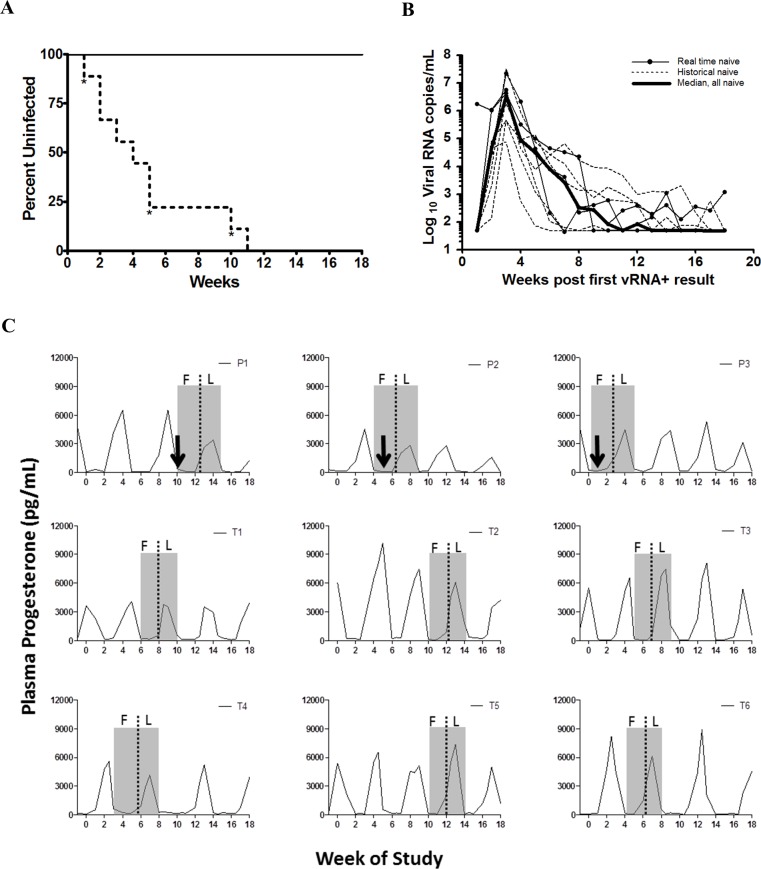
Fig 3.
TDF-FTC pod-IVR efficacy in macaques (A) Kaplan-Meier plot showing complete protection for 18 weeks in TDF-FTC group (n = 6, solid line) compared to naïve group (n = 6 historical controls, n = 3 real time controls, dotted line. * indicates time of infection for real time controls). P = 0.0002, Log rank test. (B) Peak viral loads of infected controls (dotted lines, historical controls; narrow solid lines, real time controls; bold line, median. Limit of detection was 50 viral RNA copies/mL of plasma. (C) Relationship of menstrual cycle and time of infection. Macaque plasma was monitored for progesterone over the course of the challenge study to confirm menstrual cycles and determine timing of infection. Day 1 of the menstrual cycle corresponds to the steep drop in progesterone after peak level for that month (shaded boxes represent one cycle: F—follicular, L—luteal). Arrows depict time of infection assuming a one week eclipse period from infection to detection of viral RNA in plasma. P1-P3, real-time naïve control animals; T1-T6, pod-IVR-treated animals.

