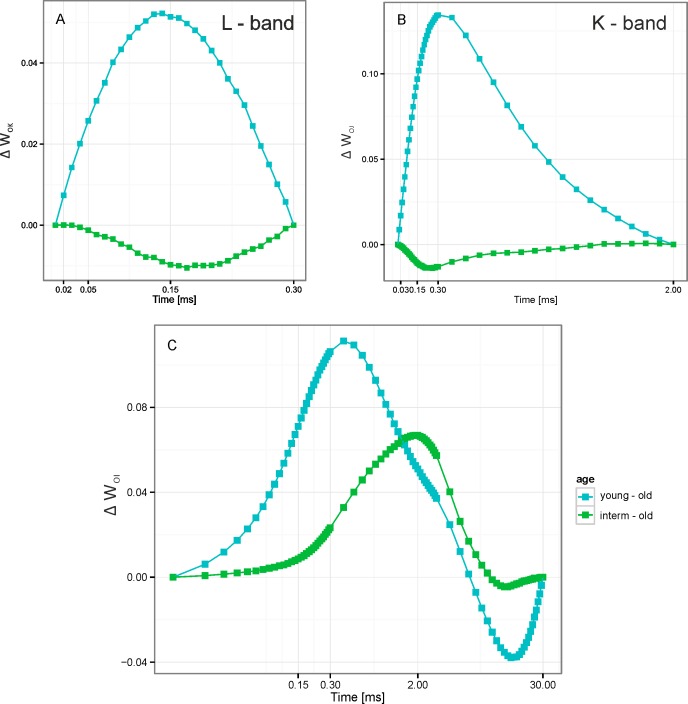
Fig 4. The chlorophyll fluorescence transients from dark-adapted leaves of expansive grass Brachypodium pinnatum.
A. ChlF curves represent the increase of the relative variable fluorescence in young and intermediate age population relative to old ones (treated as control) between points FO and FK; ΔWOK = (Ft-FO)/(FK-FO); L–band. B. ChlF curves represent the increase of the relative variable fluorescence in young and intermediate age population relative to old (control) ones between points FO and FJ (ΔWOJ = (Ft-FO)/(FJ-FO); K-band, C. The curves represent the increase of the relative variable fluorescence in young and intermediate age population relative to old (control) ones between points FO and FI (ΔWOI = (Ft-FO)/(FI-FO).

