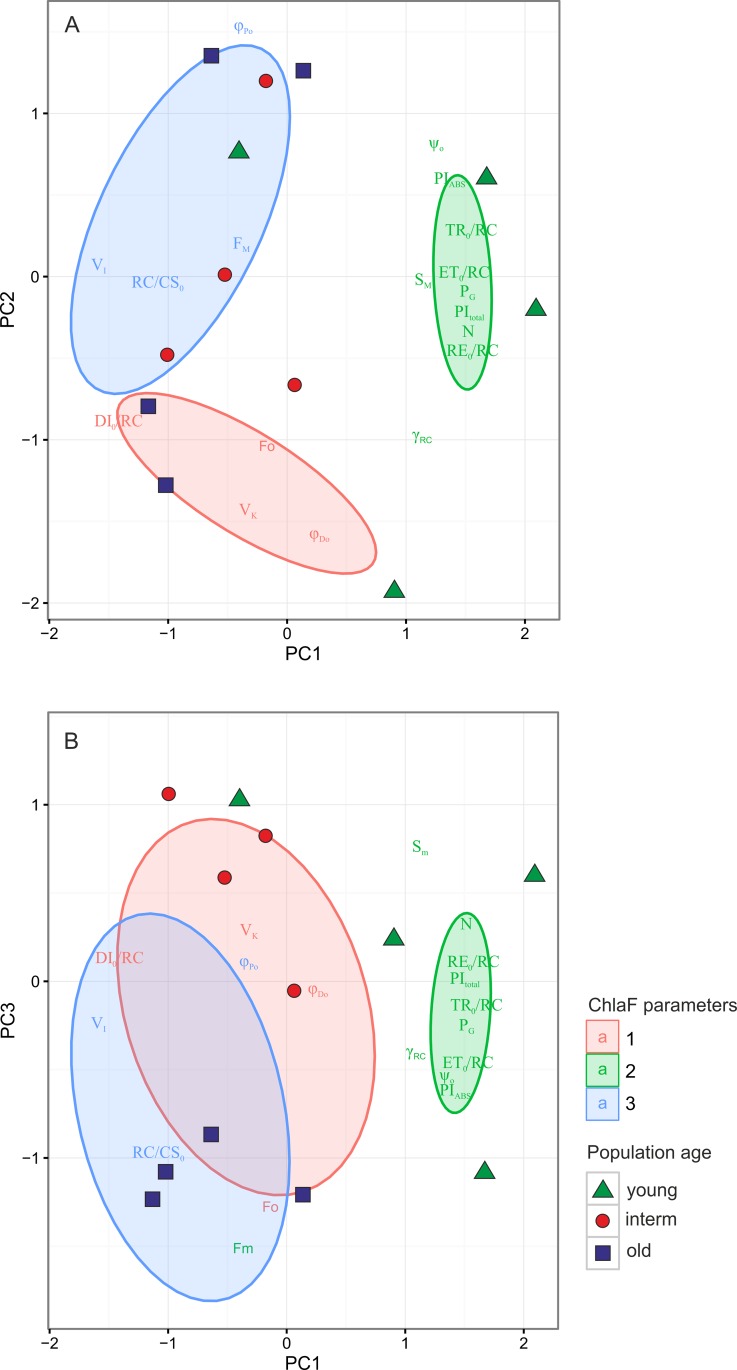
Fig 5. Principal Component (PCA) ordination diagram displaying the relationships between the Chl a fluorescence measurements and parameters.
The classification of Chl a fluorescence parameters were performed with k-means clustering. The optimal number of groups (3) was estimated based on Caliński-Harabasz criterion. The result of classification was superimposed onto the ordination diagram. The ellipses represent 95% confidence intervals for the groups

