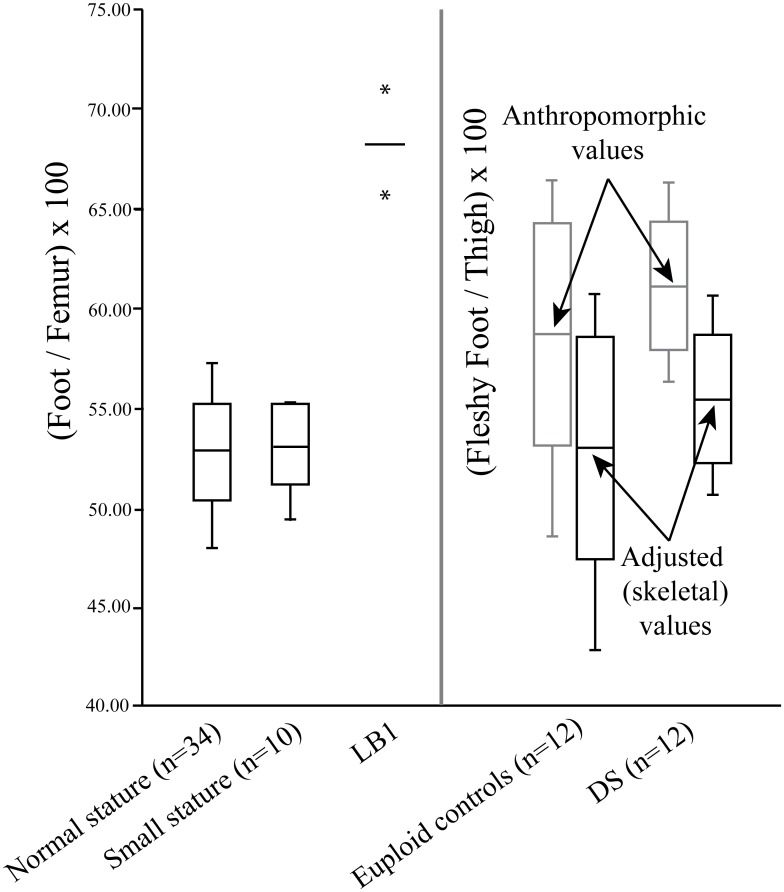
Fig 9. Plot of the foot:femur (or foot:thigh) ratio in recent humans of normal stature and short stature, LB1, and a DS and a matched euploid control sample.
The box-and-whisker plots include the mean and ±1 SD as well as the range. The asterisks for the LB1 value are the 95% confidence intervals based on the regression equation used to obtain the estimate [7]. The fleshy foot:thigh bars labeled “anthropometric” are the values based on the data from the DS and euploid control samples from Smith and Ulrich [115], while the bars labeled “adjusted” represent the raw values adjusted to make them more comparable to the skeletal ratios (see text for details).

